SPIEDigitalLibrary.org/conference-proceedings-of-spie
Multispectral autoflourescence detection of skin neoplasia using steady-state techniques
Ekaterina Borisova, Alexander Gisbrecht, Tsanislava Genova-Hristova, Petranka Troyanova, Elmira Pavlova, et al.
Ekaterina Borisova, Alexander Gisbrecht, Tsanislava Genova-Hristova, Petranka Troyanova, Elmira Pavlova, Nikolay Penkov, Ivan Bratchenko, Valery Zakharov, Ilze Lihachova, Ilona Kuzmina, Janis Spigulis, "Multispectral autoflourescence detection of skin neoplasia using steady-state techniques," Proc. SPIE 11047, 20th International Conference and School on Quantum Electronics: Laser Physics and Applications, 1104704 (29 January 2019); doi: 10.1117/12.2516337
Еvent: International Conference and School on Quantum Electronics "Laser Physics and Applications": ICSQE 2018, 2018, Nessebar, Bulgaria
Multispectral Autofluorescence Detection of Skin Neoplasia Using Steady-state Techniques
Ekaterina Borisovaa,b , Alexander Gisbrecht a, Tsanislava Genova-Hristova a, Petranka Troyanova c,Elmira Pavlova c, Nikolay Penkovc, Ivan Bratchenko d , Valery Zakharovd , Ilze Lihachova e, IlonaKuzmina e, Janis Spigulis eaInstitute of Electronics-BAS, Tsarigradsko chaussee Blvd. 72, 1784 Sofia, Bulgariab Saratov State University, 83, Astrahanskaya str., 410012, Saratov, Russian FederationcUniversity Hospital “Tsaritsa Yoanna – ISUL”, 8, Byalo more str., 1572 Sofia, Bulgariad Samara National Research University, 34, Moskovskoye shosse, Samara, 443086 RussiaeInstitute of Atomic Physics and Spectroscopy, University of Latvia, 1586 Riga, Latvia
ABSTRACT
In the current study were used excitation-emission matrices (EEMs) and synchronous fluorescence spectroscopy (SFS)steady-state techniques in a broad spectral regions (excitation at 220-500 nm and emission at 280-850 nm) to achieve thewhole set of endogenous fluorophores, existed in normal and neoplastic cutaneous tissues. Several types of benign,dysplastic and malignant types of skin lesions were investigated ex vivo using both EEM and SFS modalities, namely thebasal cell papilloma and carcinoma, pigmented nevi, dysplastic nevi, squamous cell carcinoma and malignant melanoma.Histological analysis was used as a “gold standard” for evaluation of clinical diagnosis of the lesions investigated.Comparison with the normal skin tissue spectral data was made, based on the signals detected from the safety marginsareas of the surgically excised tumours.
EEM and SFS data reveal statistically significant differences between variety of benign, dysplastic and malignantlesions, which could be used as fingerprints, applicable for differentiation algorithms. In a few of malignanciesendogenous porphyrins signals were even observed, but in general the fluorescence signals were addressed to the co-enzymes, such as NADH, flavins; structural proteins, such as collagen, elastin and their cross-links, as well as keratin inthe case of basal cell lesions. Pigments, such as hemoglobin and melanin distorted the signal due to intrinsic fluorophoressignal reabsorption, what has to be taken into account when the algorithms for discrimination of the pathology types aredeveloped.
Keywords: skin cancer, endogenous fluorophores, excitation-emission matrix, synchronous fluorescence spectroscopy
1. INTRODUCTION
Nevertheless of the easy access to the cutaneous tissues the long list of benign and dysplastic pathologies, varieties of the skin phototypes and, on the contrary, the similarity between different types of malignancies by morphology and pigmentation levels leads to low diagnostic accuracy for clinical evaluation of the lesions observed. 1 Novel techniques for detection and discrimination are investigated to raise the diagnostic accuracy values. 2, 3
The human skin is a very complex, inhomogeneous and multilayered organ with depth varying optical properties. A hugevariety of skin pathologies with different biochemical, morphological and optical properties also increases the level ofcomplexity for analysis and evaluation of their health condition.4 Fluorescence spectroscopy is discussed as one of themost promising and sensitive techniques that could be used for discrimination of this bouquet of cutaneous alterationswhich appear when a pathologic process started up in the skin. Time-resolved fluorescence techniques require highly-specific and expensive equipment, therefore for an initial clinical detection are more appropriate steady-state fluorescenttechniques which could work with cheaper light sources, used as excitation ones, and steady-state techniques allow toaddress the whole set of endogenous fluorophores and their relative concentration in the tissues investigated.5
* borisova@ie.bas.bg, phone +3592 979 5894, fax +3592 975 3201; ie-bas.org
Fluorescence spectroscopy of cutaneous tissues is one of such promising modalities and the possibility to process thetissue endogenous chromophores signal without adding fluorescent markers or other contrast agents makes this techniquevery attractive for initial diagnostics applications. The fluorescence technique based on the detection of a bulk ofintrinsic compounds with a broad range of excitation and emission spectra could be made using scanning spectroscopymodalities, such as excitation-emission matrices detection, or synchronous fluorescence spectroscopy. In the first type ofdetection the excitation wavelength is scanned with some specific step and whole emission spectrum in a specificspectral range is scanned on the fixed excitation. Combined set of such fixed single wavelength excitation - broadspectral wavelength range emission allow developing of so called excitation-emission matrices (EEMs).
In the second approach, so called synchronous fluorescence spectroscopy (SFS), the excitation and emission are scannedsimultaneously with specific wavelength difference between them. In this modality the effective high-intensityfluorescence signal could be obtained only in the case if the delta lambda is matched to the specific difference betweenmaxima of excitation and fluorescence of the compound detected. The SFS matrices could be developed if thewavelength difference applied is scanned in specific range. For the native tissue fluorophores the range of suchdifferences could be between 10 and 200 nm, as the excitation and emission spectra cover quite broad spectral rangesand the maxima could lead in almost whole ultraviolet and visible spectral ranges. Therefore, the excitation wavelengthsused are in the range of 250-450 nm spectral region, and emission of possible endogenous fluorophores is foreseen in280-850 nm.
In our studies we investigated the skin samples ex vivo, obtained after surgical excision, containing so called safety ares,where a normal skin could be observed and cutaneous lesions including benign, dysplastic and malignant pathologies, toobtain a complex and complete view about the feasibility of EEMs and SFSs techniques solely and/or in combination todiagnose cutaneous neoplasia. These are preliminary investigations based on ex vivo samples, which would be followedby in vivo investigations and comparative studies to obtain the diagnostic accuracy, using optical spectral techniques,which would surpass the existing clinical techniques for early detection and evaluation of skin cancer.
2. MATERIALS AND METHODS
Measurements were made on skin samples ex vivo – surgically excised cutaneous tumour tissues – dysplastic nevi,malignant melanoma, basal cell carcinoma, squamous cell carcinoma, keratoacanthoma lesions. The different skintumour lesions were obtained from University Hospital “Tsaritsa Ioanna-ISUL”, Sofia, in the frames of collaborationwith the Institute of Electronics, Bulgarian Academy of Sciences. All ethical issues and approvals for work with thesetissue samples were received from the ethical committee of the hospital.
Fluorescence measurements were carried out with a spectrofluorimeter FluoroLog 3 (HORIBA Jobin Yvon, France). Thesystem is equipped with a light source – xenon lamp with output light power of 300 W, performance in the 200-850 nmregion and photomultiplier (PMT) detector with performance range of 220-850 nm for fluorescence detection. Thesamples were measured using additional fibro-optic module (F-3000 HORIBA Jobin Yvon Inc., France), which allowsinvestigation of samples outside of the sample chamber, since the surgically excised tissue samples vary in size andshape. During the experiment the optical fiber of the used fiberoptic module was positioned perpendicularly to thesample with fixed geometry and the tip of the fiber was brought in contact with the tissue, in order to reduce thefluorescence signal interference by the backscattered excitation light, the area of illumination of the sample correspondswith the surface of the tip of the optical fiber. No additional pressure was used for a better contact, to not alter thespectral properties of the tissues investigated, and when the fiber probe end tip touch the tissue surface it was fixed to notinfluent the tissue samples optical properties.
The fluorescence of the safe-keeping solution used for surgically removed tissue samples investigated ex vivo was evaluated as significantly negligible in comparison with the investigated tissue fluorescence itself. The shape and dimensions of the tissue samples vary depending on the size and pattern of the excised tumor, however the thickness of the investigated samples do not exceed 7 mm.
Excitation-emission matrices were developed using the following spectral ranges- for excitation wavelength range from 280 to 440 nm was applied, with a step of 10 nm between the excitation applied. The emission was detected in the region of 300 to 850 nm with a step of scanning detection of 1 nm.
Synchronous fluorescence spectroscopy approach was used in the regions 280-440 nm for excitation and 300-800 nm for the emission with variation of delta lambda between the scanned excitation-emission from 0 to 200 nm with a step of 10 nm. Integration time applied was 0,1 s for each measurement in both spectral modalities applied, to have possibility to compare the fluorescence intensities of different compounds.
All tissue samples where investigated as well using histological techniques to obtain the “gold standard” data about the proper diagnosis of the tissues investigated. The histological examination results were used for grouping of the spectral data from different tissue samples investigated and averaging of the spectral data for such received set of fluorescent spectra addressing a given type of pathology.
3. RESULTS AND DISCUSSION
The completed measurements provided spectral data with their specific characteristics, which diagnostic value could be evaluated through a comparison of the optical properties of the tissues investigated. The investigated samples were cutaneous tumours ex vivo, obtained after surgical removal and kept in a safe-keeping solution.
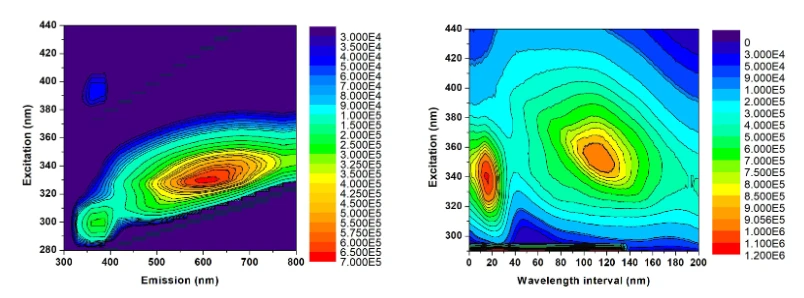
On figure 1 are presented EEM and SFS data for normal skin. Two big islands are observed in both cases- short- wavelength one, which is related to amino acids fluorescence (excitation 280-320 nm, emission 300-400 nm, delta lambda 0-40 nm) and long-wavelength one, which consists of several sub-forms, corresponding to the proteins and co- enzymes (excitation 300-400 nm, emission 400-600 nm, delta lambda 40-200 nm).

Figure 1. Endogenous fluorescence of normal skin in EEM (left) and SFS (right) 2-D fluorescent mapping format.
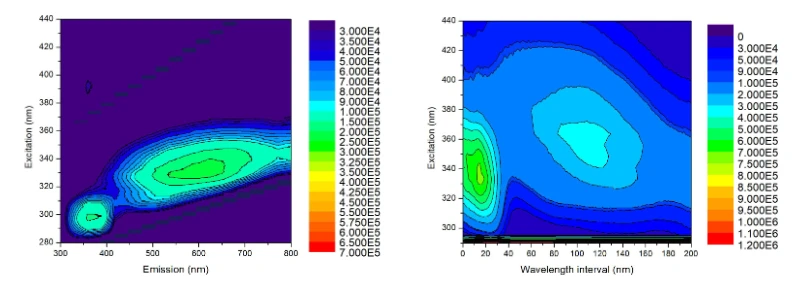
Fluorescence maps allow evaluating the major maxima and corresponding excitation and emission pairs, which addressthe specific compound. Significant intensity alterations are observed in the case of pathological changes. On figure 2 arepresented the EEM and SFS data for malignant melanoma lesion using the same intensity scale as for the normal skingraphics. It is clearly pronounced that range of long wavelength fluorescence signal reveal much lower emission than thenormal skin tissue. The data presented in 2-D maps allow us to obtain general overview about the ranges of thefluorophores that exist in the tissue under interest and to compare the intensity levels in quantitative way. However, if wewant to be more precise in our comparative studies and to find the fine elements of the spectral alterations betweendifferent types of skin pathologies, which could be used as diagnostic indicators, it is better to work with the comparisonfor a fixed wavelength of excitation between normal and abnormal tissues.
Moreover, the 2-D map regime does not allow observing easily the single components related to single fluorophores in the tissues investigated. In spectroscopic mode of data presentation the specific maxima are more pronounced and could be easily addressed, especially in SFS format, which due to its nature lead to narrowing of the fluorescent maxima detected in this specific modality.7

Figure 2. Endogenous fluorescence of malignant melanoma in EEM (left) and SFS (right) 2-D fluorescent mapping format.
On figure 3 are presented the averaged spectral data from EEM measurements of normal (sound skin) and abnormaltissues (superficial and pigmented basal cell carcinoma lesions) for the whole set of excitation wavelengths applied in thecurrent study (280-440 nm). One could observe the significant difference even between the BCC lesions spectral data,depending from the sub-type of the BCC lesions investigated. These peculiarities are related to the appearance ofabsorbers, mainly melanin and keratin in the case of pigmented BCC lesions, which lead to a distortion of thefluorescence spectra and rapid decrease of the emission intensities in the case of melanin-pigmented pathologies.

Figure 3. Endogenous fluorescence of normal skin, superficial basal cell carcinoma and pigmented basal cell carcinoma in EEM format spectral mode of visualisation.
There is observed reduced level of amino acids emission in the case of BCC lesions, which is related to the partialdemolition of the extracellular matrix and changes in the geometry of the lesion tissue in comparison with themorphology of the normal one. In an unit of volume, where the excitation wavelength penetrated, is situated higherconcentration of structural proteins in normal skin vs. tumour lesions, which lead to an general decrease of thefluorescence which is detected from the amino acids (emission at 300-360 nm), collagen (400-460 nm) and collagencross-links (480-520 nm). In the same type of lesions the quantity of keratin became higher, which lead to relativeincrease of the fluorescence signal in the green spectral region, due to the fluorescence source of keratin plates. The metabolic activity is also increased in the tumour cells, which lead to some relative higher pronunciation of the flavins and NADH fluorescence respectively at 500-540 nm and 420-460 nm.
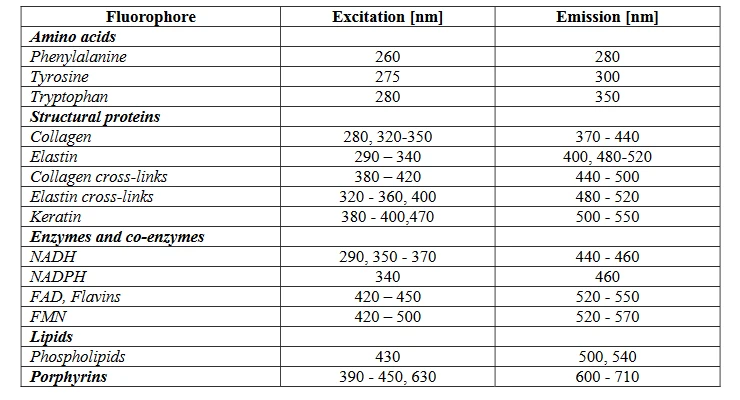
metabolic activity is also increased in the tumour cells, which lead to some relative higher pronunciation of the flavinsand NADH fluorescence respectively at 500-540 nm and 420-460 nm.If spectra of normal and abnormal tissues are compared side by side for each excitation wavelength (in the case of EEMregime of measurements) and for each delta lambda (for SFS regime of measurements) could be obtained whole set ofspecific features for every type of pathology and fluorophores, that naturally occur in the lesions investigated. The list ofthe addressed endogenous fluorophores observed in the cutaneous lesions investigated, is presented in table 1.
Table 1. Endogenous fluorophores addressed using steady state EEM and SFS modalities in different cutaneous lesions and normal skin.

The changes in the EEM and SFS autofluorescence maps of skin samples are a consequence of malignanttransformations of cells, leading to differences in the fluorescence properties of the skin. The structural protein collagen,one of the most informative fluorophores and a main component of extracellular matrix, plays a crucial role in thedegradation and penetration of basal membrane. The transformation from normal to malignant tissue, the enzymemetalloproteinase collagenase is responsible for degradation of collagen and changes in the cross-links of collagen,which are responsible for changes in fluorescent properties.8 The autofluorescence spectra shows a decrease in theconcentration of collagen in malignant tissue compared to normal skin, which is well corresponding with the literaturedata.
In the spectra presented at Fig. 3 with excitation of 350 nm, the peak at 450 nm corresponds to the emission of NADH.Co-enzymes NADH and NADPH are main fluorophores, responsible for the shape of fluorescence spectra of the skinand other tissue types, they play an important role in metabolic oxidation-reduction processes. When the tumour occursthe related cells proliferate quickly and the ratio between the oxidized and the reduced form of NAD could vary. Theaccumulation of less fluorescent NAD+ results in the decrease of the fluorescence intensity in malignancies. Themetabolic, physiological and pathological changes of tissue have influence on the variation in concentrations of the bothcoenzymes; see Fig. 3 (superficial and pigmented BCCs). This result corresponds well to the other investigations, relatedto skin cancer detection.
4. CONCLUSIONS
Using autofluorescence detection of skin benign and malignant lesions we obtain very good diagnostic performance for distinguishing of non-melanoma lesions from other simulating benign and malignant pathologies. Therefore, the possibility to obtain new knowledge about the optical and spectral properties for skin benign, dysplastic and malignant tissues, based on steady-state autofluorescence optical detection, improved the quality of the performed differentiation and could contribute to a better understanding of the observed spectral peculiarities of the cutaneous neoplasia, as well to address the whole set of endogenous fluorophores in the tissues investigated.
ACKNOWLEDGEMENTS
These investigations are supported in part in the frames of NSF-MES project DNTS/Russia 01/7-23/06/2017 and by bilateral project for academic exchange between Bulgaria and Latvia “Multispectral and fluorescent imaging of skin tumours”.
REFERENCES
[1] Johansson, A., Kromer, K., Sroka, R., Stepp, H., "Clinical optical diagnostics: Status and perspectives," Med.
Las. Appl. 23, 155-174 (2008).
[2] Troyanova P.,“A beneficial effect of a short-term formal training course in epiluminescence microscopy on the
diagnostic performance of dermatologists about cutaneous malignant melanoma,” Skin Res Tech. 9, 269–273
(2003).
[3] Bachmann, L., Zezell, D., da Costa Ribeiro, A., Gomes, L., Ito, A., “Fluorescence spectroscopy of biological
tissues – a review,” Appl. Spectr. Rev 41, 575-593 (2006).
[4] Spigulis, J., Rubins, U., Kviesis-Kipge, E., and Rubenis, O., “SkImager: a concept device for in-vivo skin
assessment by multimodal imaging,” Proc. of the Estonian Academy of Sciences 63, 3, 301–308 (2014).
[5] Genova, Ts., Borisova, E., Penkov, N., Vladimirov, B., Zhelyazkova, Al., Avramov, L., “Excitation– emission
matrices and synchronous fluorescence spectroscopy for cancer diagnostics in gastrointestinal tract,” Quantum
Electronics 46 (6), 510 –514 (2016).
[6] Borisova, E., Zhelyazkova, Al., Keremedchiev, M., Penkov, N., Semyachkina-Glushkovskaya, O., Avramov,
L., “Endogenous synchronous fluorescence spectroscopy (SFS) of basal cell carcinoma – initial study,” Optics
and Spectroscopy, 120(1), 43-49 (2016).
[7] Liu, Q., Chen, K., Martin, M., Wintenberg, A., Lenarduzzi Masoud Panjehpour, R., Overholt, B. F., Vo-Dinh,
Tu., “Development of a synchronous fluorescence imaging system and data analysis methods,” Optics Express
15(20), 1258-31, (2007).
[8] Drami´canin, T., Lenhardt, L., Zekovi´c, I., Drami´canin, M. D., “Biophysical characterization of human breast
tissues by photoluminescence excitation-emission spectroscopy,” Journal of Research in Physics 36(1), 53 – 62,
(2012).
[9] Zhelyazkova, A., Borisova, E., Angelova, L., Pavlova, E., Kermedchiev, M., „Excitation-emission matrices
measurements of human cutaneous lesions: tool for fluorescence origin,” Proc. SPIE 9032, 90320A, (2013).
